Clutching a list of groceries for her and her son, Christine O’Connor has made a lunchtime dash to the supermarket.
In her basket are some veges and fruit. She is now in the butchery section, making more hard choices.
This week’s news that meat, poultry, and fish prices increased 6% in the past year does not surprise the Dunedin photographer. If anything, she feels the price hike has been steeper than that.
"I find I’m buying less meat and cheaper cuts," Christine says.
"Making do with less and making it go further."
She is delighted to find a small tray of skinless chicken thighs and one of chicken sausages, both short-dated and heavily discounted.
Lamb chops are also on special this week. She adds a plastic-wrapped tray bearing two chops to her basket.
"In the past, I would have bought more than that. Now, it’s one each."
A dollar, Christine says, does not seem to go as far as it used to, nor as far as it should.
This is backed up, to an extent, by the Consumer Price Index (CPI).
The CPI is one of the fundamental tools used to measure the health of the economy and citizens’ standard of living. It is a representative basket of almost everything we pay for — from groceries, footwear and dining room suites to piano lessons, student loan fees and funeral services. Statistics New Zealand (Stats NZ) keeps tabs on the prices of all the items in that basket to calculate the change in the price of goods and services over time.
As such, the CPI is an important and influential measure of inflation for all New Zealand households. It is used by the Reserve Bank of New Zealand (RBNZ) to help set monetary policy and monitor economic performance. It is used by the Government to adjust New Zealand Superannuation and unemployment benefit payments. Employers and employees use the CPI in wage negotiations.
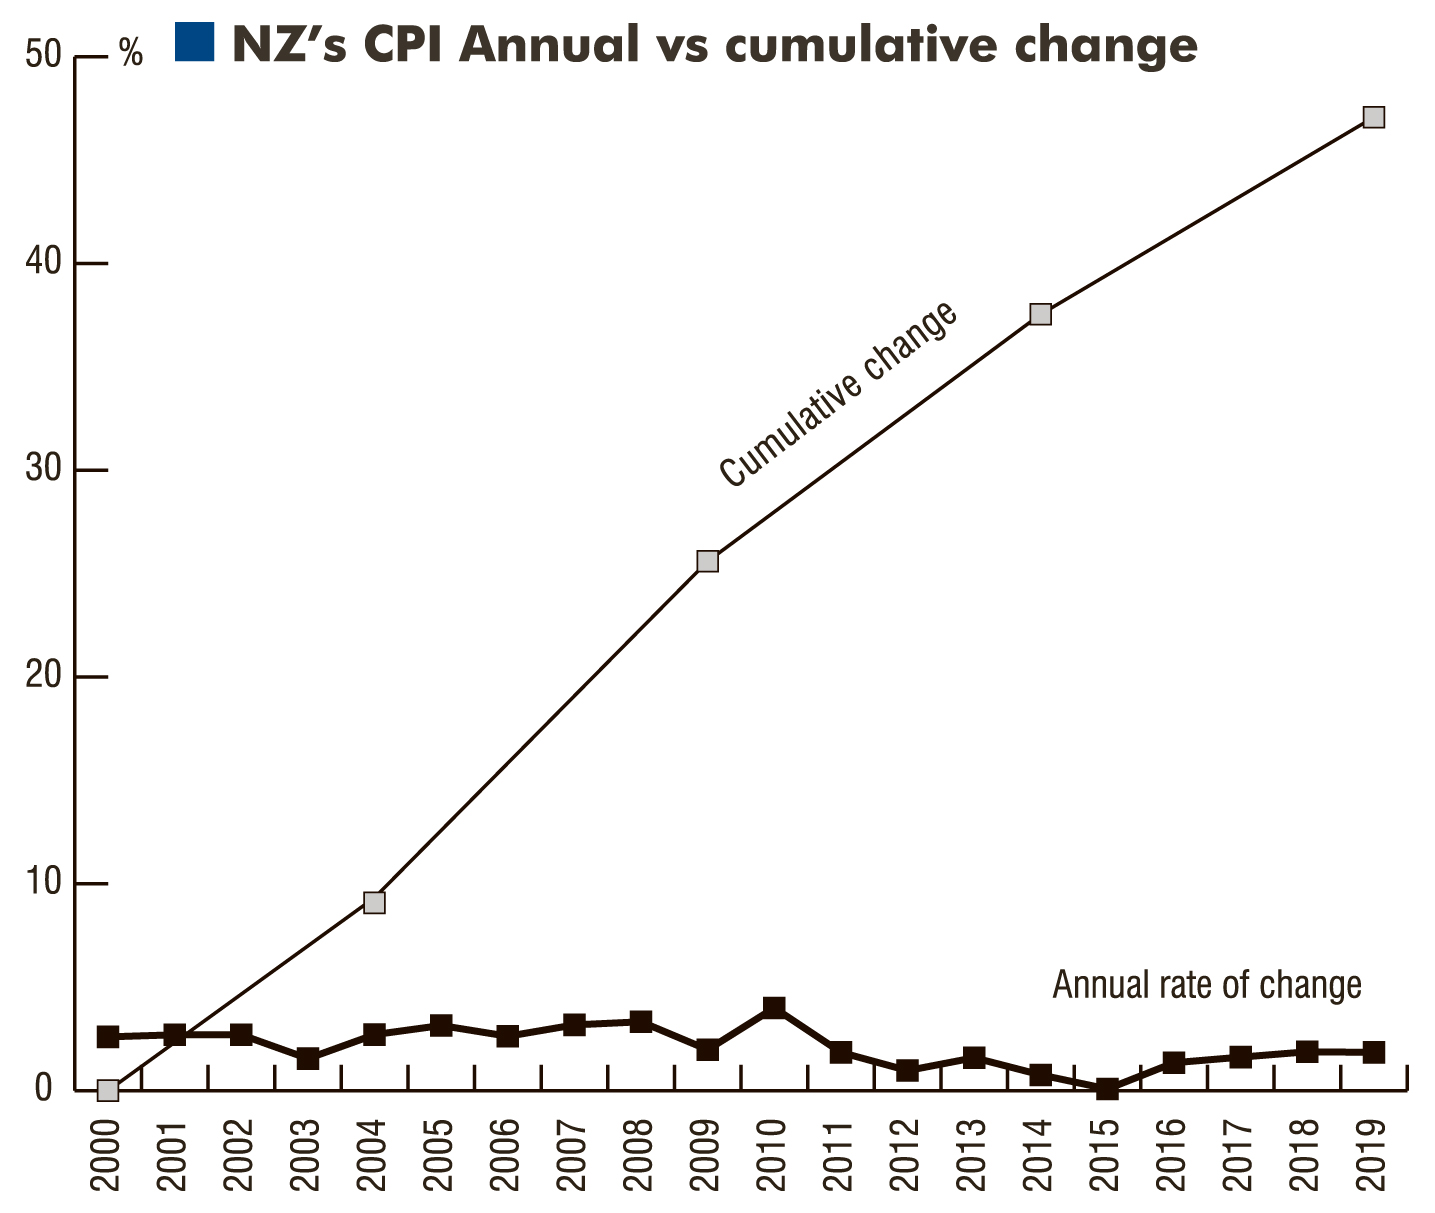
Last year, the CPI rose by 1.9%. The year before was about the same. Since 2010, the average increase in the CPI has been 1.5% per year. That adds up. According to the CPI, the cost of everything has risen 12.6% in a decade. Over that time, the purchasing power of your 2010 one dollar coin has declined more than 11%.

A small group of economists, it turns out, have been saying that for years.
Economists of all ilks agree there are a cluster of small-to-medium criticisms of the CPI. Most of the problems stem from the CPI’s laudable attempt to calculate an all-encompassing household inflation rate — for a population that is anything but homogeneous.
In 1914, CPI price surveys were carried out in 25 urban areas throughout New Zealand. However, during the past century, that has been whittled down to 12 towns and cities, and the results broken down into five broad regions: Auckland, Wellington, Rest of North Island, Canterbury, and Rest of South Island. That means it is sometimes hard to see the inflationary trees for the wood.
If saying the CPI was 1.9% for the country does not necessarily reflect what was going on in Cromwell or Kaitaia, the same problem exists for different demographics, be they age, stage or socio-economic. Students filling North Dunedin for a new academic year do not buy the same basket of goods and services as a retired Belleknowes couple with a holiday home in Central Otago and a rental property in Milton. And they in turn have a different basket to that of their beneficiary tenants. If student loan policy, superannuation and welfare benefits are all determined to some degree by the CPI, one overall rate is not a good enough guide, critics say.
Those irritations aside, most economists say the CPI is a complicated yet accurate way of measuring the price inflation that ordinary citizens experience.
Begging to differ, however, are economists who subscribe to the Austrian School of economic thought.
They say even the conventional understanding of inflation is flawed, masking what is really going on.
The Austrian School is a late-nineteenth century theory of economics that emphasises the role of individuals in understanding how the economy functions.
"Austrians", as they are called in economic circles, point to two mechanisms in the CPI method that they say makes inflation appear lower than it really is.
The first is the practice of calculating quality improvement. Every three years, Stats NZ reviews what is in the CPI basket. A revision is due this year. If, for example, a newer model of a $30,000 car in the basket comes on the market for $40,000, the boffins at Stats NZ try to work out how much of that $10,000 increase is quality improvement — say, the addition of all-wheel drive, crash avoidance technology and wireless connectivity — and how much of it is a simple increase in the price. The quality improvement bit of the price increase is written off. If $7000 is attributed to quality improvement then the increase in price is deemed to be just $3000, an inflation rate of 10% instead of 33%.


Prof Berg says the differences zero in on a dispute about the true definition of inflation; a dispute that has important implications.
Orthodox economists focus on the price of goods and services to calculate inflation. Austrians say money supply is the key.
Orthodoxy has it that the economy is always in equilibrium. Everyone, for instance, is thought of as having equal information. So when new money is introduced to the economy, it works its way through equally, resulting in all prices, including wages, rising by the same percent.
Austrians, in contrast, see money supply as the cause of inflation and prices as simply an effect.
"The Austrian view sees the economy as always in a state of disequilibrium where information is decentralised — everyone has their own partial information and undertakes purposeful action based on what they know," Prof Berg says.
This process of new money creation generates an inefficient and unfair situation where those who receive newly printed money first get to spend it before prices go up, while those who get to spend it in later rounds after prices have risen see the purchasing power of their wages and savings eroded.
"Austrians view inflation of the money supply as rewarding unproductive behaviour, that is borrowing and speculating, while hurting the most productive people in the economy who are trying to save and get ahead."
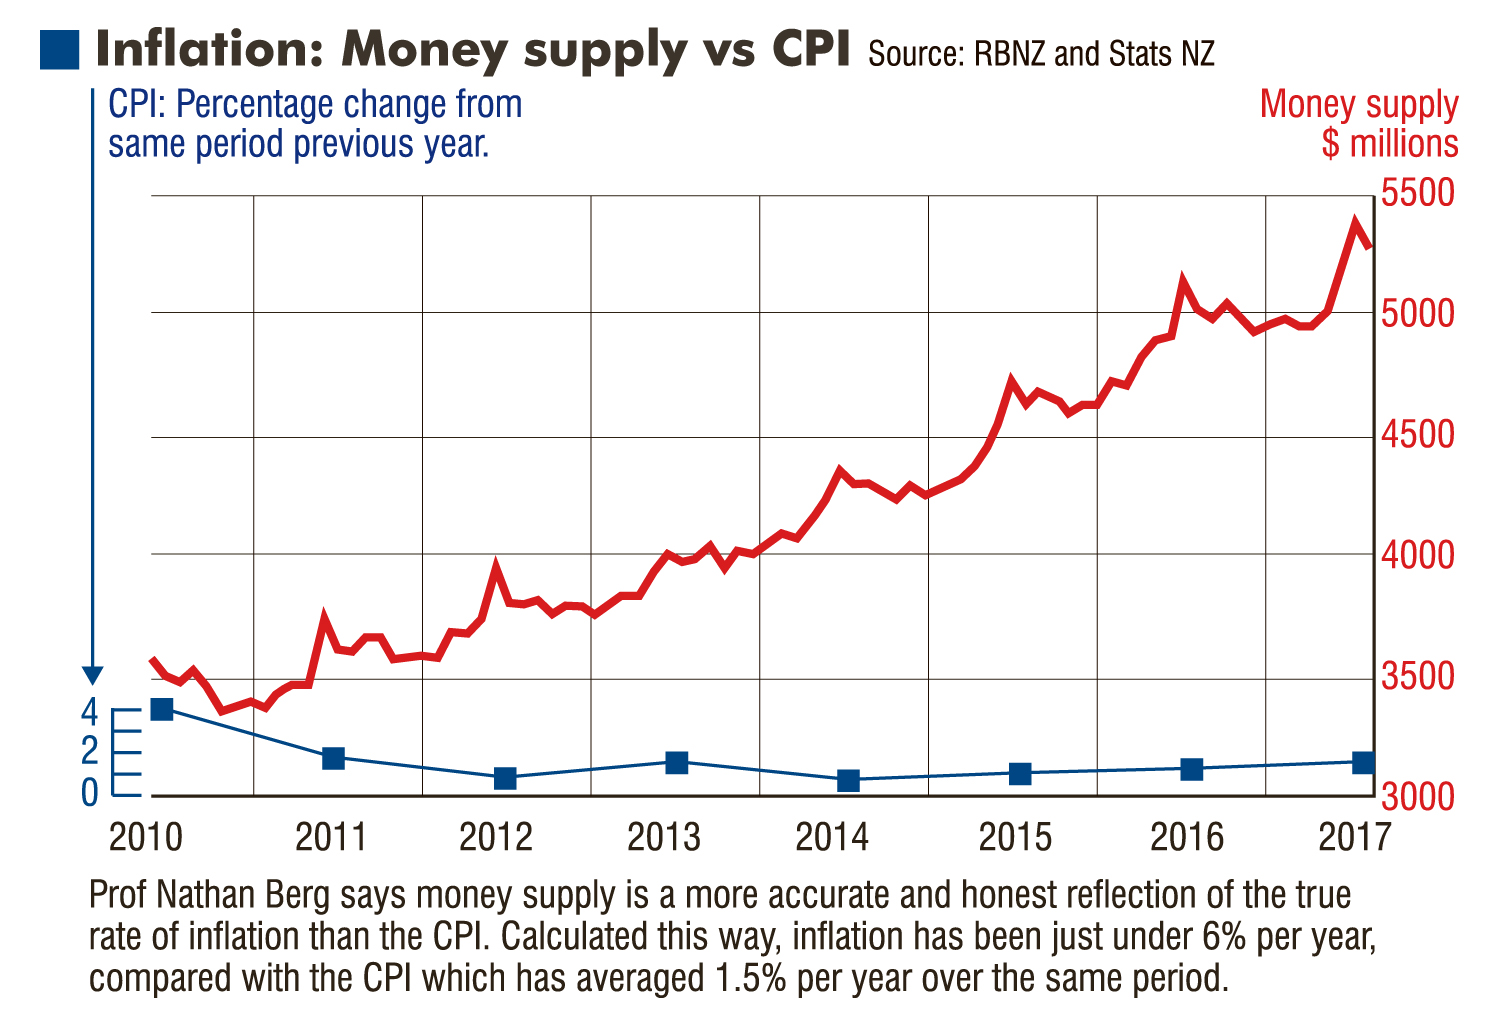
If the Austrians are right, then the place to go looking for the true level of inflation is in the money supply, the cause of inflation.
There, the figures speak for themselves.
In the seven years to 2017, the CPI bumped along at a humble average of 1.5% per year. The amount of money sloshing around in the New Zealand economy, on the other hand, rose from $3.5billion to $5.3billion. A more than 50% increase.
According to the Austrians that would mean an inflation rate of at least 6% per year, four times higher than we are told it is.
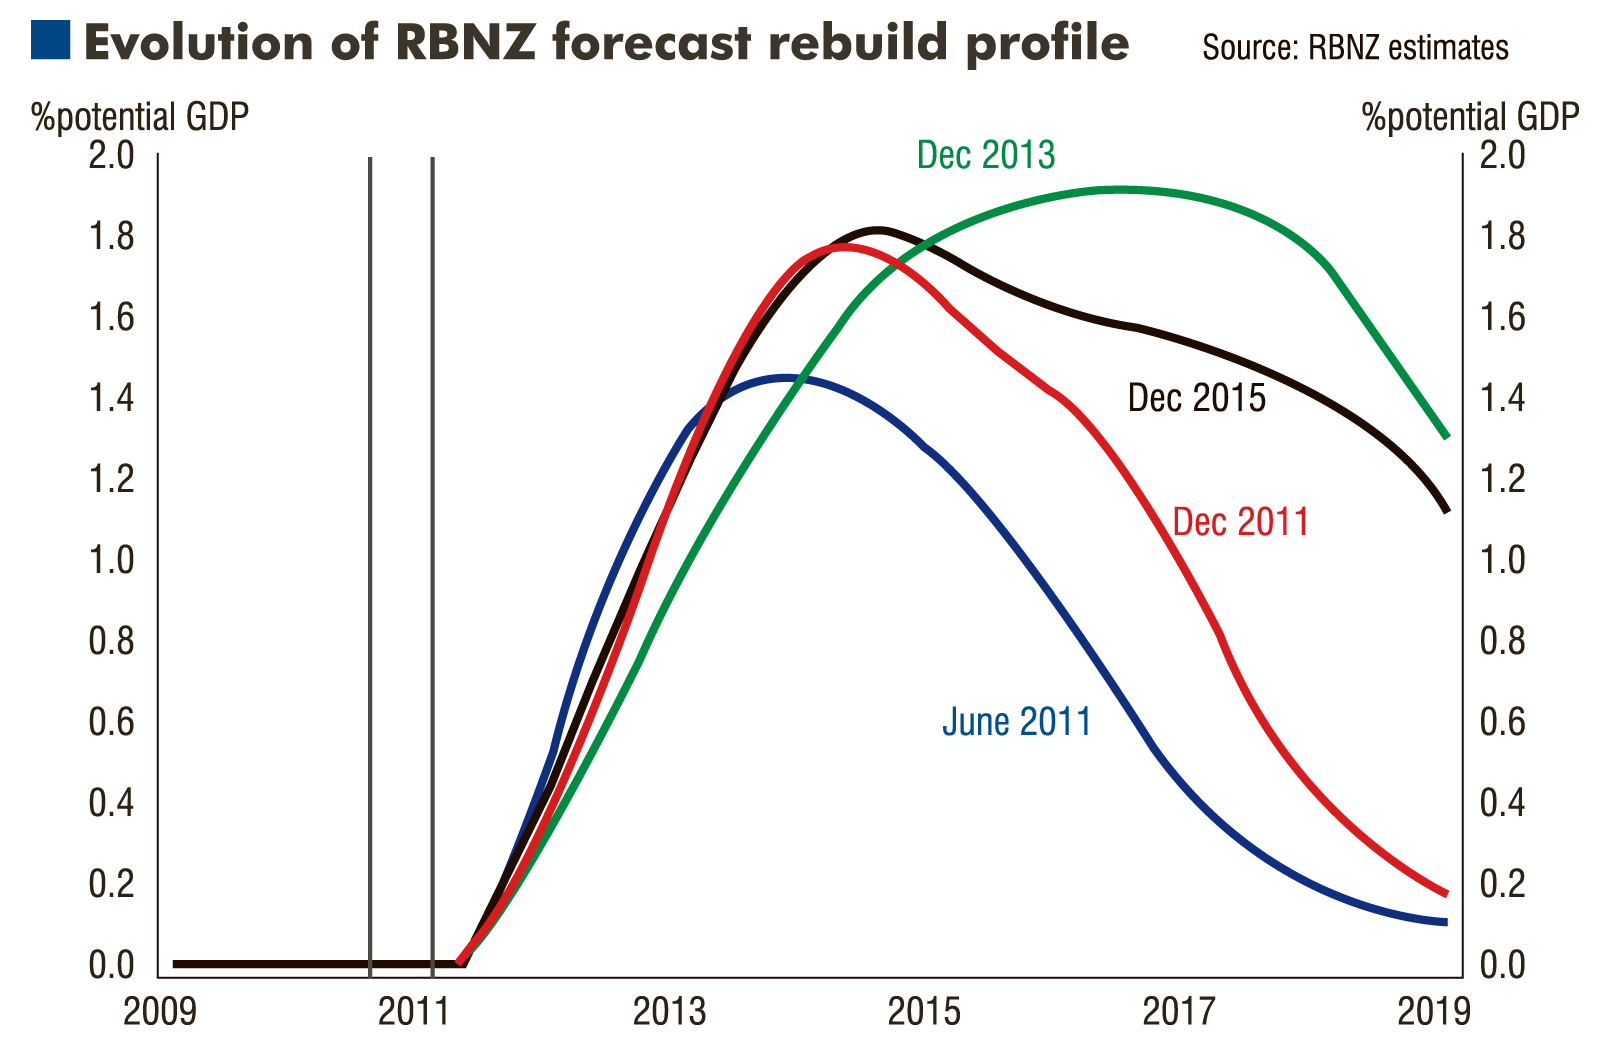
Another place to find a truer rate of inflation is in the wake of natural disasters, the Austrians say.
There, the actual increase in the cost of replacing things comes into plain view.

There is another reason the price of goods and services, that is the CPI, is not the right place to go looking for the true rate of inflation, Prof Berg says: governments are incentivised to make the CPI appear as low as possible.
Complex formulas to take "quality improvement" out of the equation and methods that track an ever-changing basket of goods play into governments’ desire to show as low a rate of inflation as possible.
Being able to report to voters yet another quarter of below-2% inflation is important in a three-early election cycle.
Also, an under-reported inflation statistic helps governments reduce their welfare spending. If reported inflation is 1.5%, that translates to a much cheaper hike in the cost of providing superannuation and unemployment benefits than if inflation was reported at 6%.
Stats NZ rejects any claim the CPI under-reports the rate of inflation.


Asked whether the Government should calculate superannuation and unemployment benefits using a more targeted CPI, Minister of Social Development Carmel Sepuloni said it was unnecessary because, as of April, adjustments to both would be calculated using not only the CPI but wage growth indicators as well.
"Wages tend to increase over and above living costs, particularly as inflation in New Zealand can now be considered to be stable and at a very low level," she said.
Prof Berg is not deterred. He is still calling for change.
He says Stats NZ should be commended for efforts to provide CPIs for different demographic groups, such as seniors. We need more of that, including region-specific CPIs, he says. He would also like Stats NZ to provide a way for researchers to see what CPI inflation would look like using different methodologies.
"I would like to put the raw data within closer reach of the people, so they could see for themselves what inflation right now would look like if we used older methods, used a smaller fixed basked of goods ... and could recalculate [CPI] without using quality or substitution adjustments in the weights."

People like Trevor Kitto who says he was "brought up on chops, roasts and steak. Bringing my kids up on mince, sausages and chicken".
Or barista Marissa Kelderman who says she has "found that it's in other areas of my life I am making cuts to offset the price of groceries. For example, I am trying to spend less on gas and cafes. That way I can still afford to purchase the groceries that I need for the family. On top of that, I always buy on special, and when something is really cheap, I bulk up and put it in the freezer".
Or Mark Cook, of Dunedin, who says, "We used to buy mince and steak way more often than we do these days. It’s too expensive now. Same with fruit and veges".


